
A peak is not simply more orders
Ten thousand additional parcels of uniform merchandise do not create the same work as the same number requiring special handling or temperature control. Promotions, weather, late inbound transport and irregular arrivals concentrate work within narrow windows. Staffing to average daily volume ignores when the work arrives and what skills it needs.
Plan backwards from the service promise
If line-haul departs at a fixed time, sorting, verification and loading must be completed before that cutoff. Delivery depots face their own dispatch deadlines; cold-chain goods have exposure constraints. Translate service-level commitments into workload and staffing requirements at each node rather than beginning with an arbitrary staff quota.
What data is needed
Begin with historical volume and order mix, site throughput, task qualifications, equipment limits, truck arrival times, leave and employment rules. Existing WMS, TMS and OMS events are useful when timestamps and status definitions can be trusted. A simple transparent model is often preferable to waiting for perfect AI forecasts.
Test forecasting and roster quality separately
Even a correct parcel-volume forecast does not identify how many people each process will need. Productivity standards, job dependencies, competencies and available hours are additional inputs. Conversely, an optimiser can create a mathematically elegant roster that is wrong because its workload assumptions were wrong. Validate each layer and the end-to-end operating result.
Cross-site support and subcontracting have hidden costs
Overtime, redeployment and temporary labour may all address a peak, but travel time, familiarisation, service errors, legal limits and total cost differ. The lowest hourly rate is not necessarily the lowest cost per successful delivery. Safety and specialist qualifications remain non-negotiable.
Track delivered service, not labour hours alone
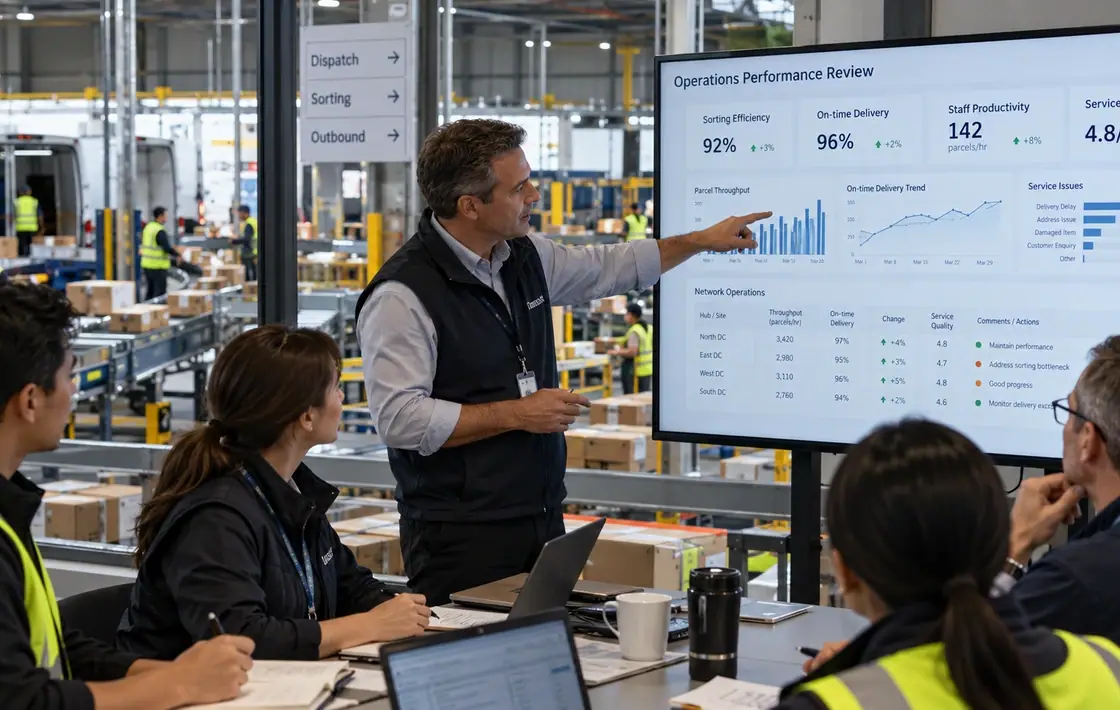
Candidate outcomes include station throughput per paid hour, overtime, on-time or OTIF delivery, damage, missed connections, rework, short-notice labour moves and cost per successful fulfilment. Compare like-for-like lanes, contracts and parcel mixes rather than declaring the highest site average the best performance.
Different logistics models require different rules
Cross-border forwarding, parcel distribution, cold chain and e-commerce fulfilment have distinct cutoffs, resources and consequences for a missed promise. Defining the service model and node role comes before choosing a scheduling algorithm. One configuration cannot sensibly represent every type of logistics business unchanged.
Time-window modelling identifies real bottlenecks
Break daily totals into release times, processing starts, dependencies and cutoffs. A departure at 22:00 requires earlier windows for induction, sorting and loading; a late arrival shrinks those windows. Track event times, standard task durations and constrained equipment, then refresh feasible staffing options as inbound conditions change.
Illustrative case: cheap staffing, expensive fulfilment
Assume a depot reduces fixed staff and relies on overtime. Off-peak payroll may fall, but peak delays, fatigued drivers, failed delivery and repeat journeys can increase total cost-to-serve. Compare the full service outcome, not just staffing spend. This is a scenario for analysis, not a claimed KPI Driven result.
Close the improvement cycle
After roster publication, compare actual workload, processing rates, waiting time, returns and exceptions with forecasts. Identify whether error came from customer demand, transport arrival or internal capacity, and revise the next workforce plan. Account for cross-site training and travel costs as well as legal work limits.
External benchmarks are not internal KPIs
The World Bank’s Logistics Performance Index addresses dimensions such as customs, infrastructure, international shipments, service quality, tracking and timeliness. It provides external context, but cannot be copied directly as an internal department scorecard. Contract and site-level measures need defined controllable processes.
Hard guardrails come before cost optimisation
Legal hours, safety training, hazardous handling credentials, temperature-control requirements and binding commitments cannot all be converted into negotiable weights. Where qualified capacity is insufficient, show the gap and operational exposure rather than publishing a roster that looks complete but cannot safely run.
Executive views should reveal network causality
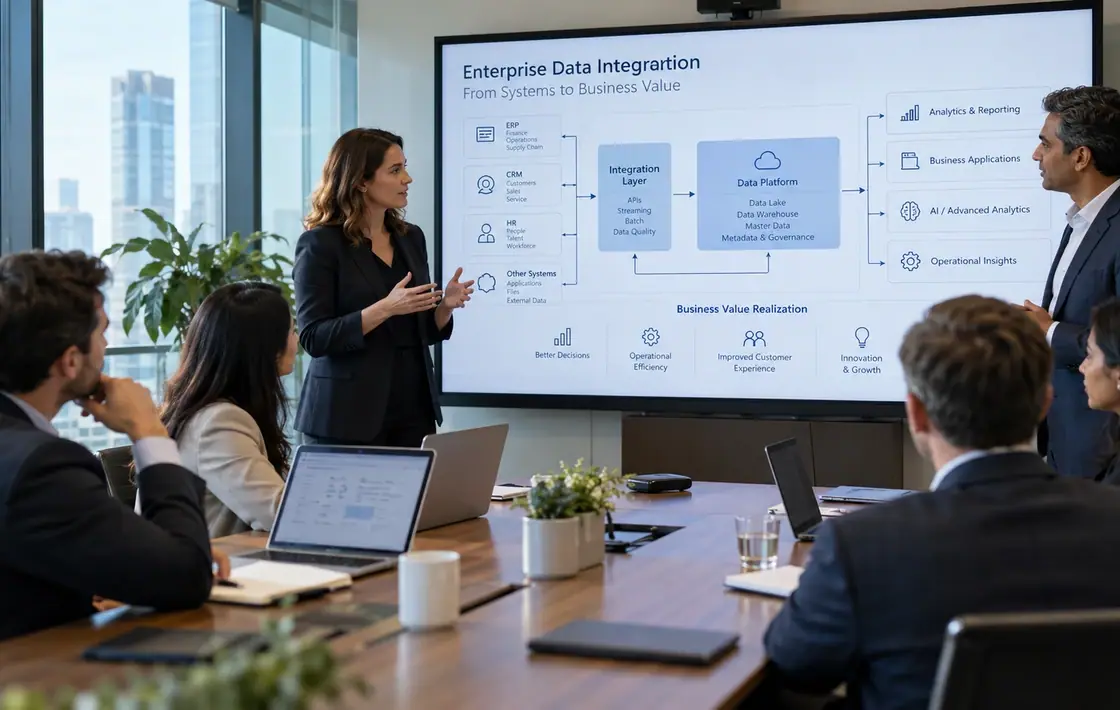
An enterprise view should connect fulfilment, cost and exceptions to line-haul arrivals, sort waves, dispatch and delivery routes. When punctuality deteriorates, distinguish late inbound freight from insufficient sort capacity or last-mile issues. Scheduling becomes a management capability when linked to network events.
References & Further Reading
The following are public third-party resources. Their inclusion does not imply any partnership or endorsement.
Measure the outcome. Verify the improvement.
Recommendations must account for operating constraints, data reliability, ownership and agreed acceptance measures before they become workable business solutions.
Discuss Your Priorities ↗